

Lighting diagram
What is a light pattern diagram?
An illuminance diagram shows how the light from a headlight is distributed over a specific area. It makes the light pattern measurable and shows the illuminance levels achieved at different positions.
For work lights, the illumination is often shown from a top-down view. This makes it possible to see how wide and how far the area in front of or next to a vehicle is illuminated.
How do you read a lighting pattern diagram?
The position of the headlight or vehicle serves as the starting point for the diagram. Distance markings on the axes indicate the distance from the headlight at which the respective measured values are achieved.
Illuminance is specified in lux. Areas with higher lux values are more brightly illuminated than areas with lower values. This makes it possible, for example, to determine whether a headlight distributes its light broadly at close range or focuses it more intensely, thereby achieving higher illuminance even at greater distances.
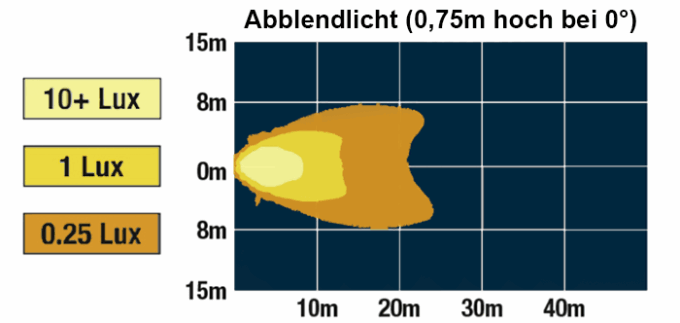
What are isolux lines?
In many illumination diagrams, points with the same illuminance are connected by lines. These are called isolux lines.
An Isolux line marked 10 lx connects points at which an illuminance of 10 lux is reached. Other lines may represent higher or lower illuminance levels. This creates a sort of contour map of light distribution. However, rather than connecting points at the same elevation, it connects areas with the same illuminance.
What does a light pattern diagram for a headlight show?
A light distribution pattern provides information that cannot be determined from the luminous flux or a value in lumens alone. Two spotlights with the same luminous flux can produce significantly different illumination patterns. For example, one spotlight may distribute the available light over a large area, while another may achieve a higher luminous intensity in specific directions.
The light distribution pattern therefore helps in determining which light pattern is suitable for a specific application.
Why can’t lighting diagrams always be compared directly?
When making a comparison, the conditions under which the diagrams were created must be taken into account. In particular, mounting height, orientation, and the angle of the floodlight influence where the light hits the depicted surface. Scaling, the area depicted, and the lux levels used may also vary between different diagrams. A meaningful comparison is therefore only possible if the underlying representations and conditions are comparable.